
Udemy – TABLEAU 2018 ADVANCED: Master Tableau in Data Science
English | Size: 5.49 GB
Category: Tutorial
Master Tableau in Data Science by solving Real-Life Analytics Problems. Learn Visualisation and Data Mining by doing! [Read more…]
Get Yourself a Better Life! Free eLearning Download
Udemy – TABLEAU 2018 ADVANCED: Master Tableau in Data Science
English | Size: 5.49 GB
Category: Tutorial
Master Tableau in Data Science by solving Real-Life Analytics Problems. Learn Visualisation and Data Mining by doing! [Read more…]

Udemy – Tableau for Business Analytics and Marketing
English | Size: 1.53 GB
Category: Tutorial
Visualize marketing data with Tableau. Take your business to the next level with data driven decisions. [Read more…]
Udemy – Tableau 2020 A-Z: Hands-On Tableau Training for Data Science
English | Size: 3.12 GB
Category: Tutorial
Learn Tableau 2020 for data science step by step. Real-life data analytics exercises & quizzes included. Learn by doing! [Read more…]
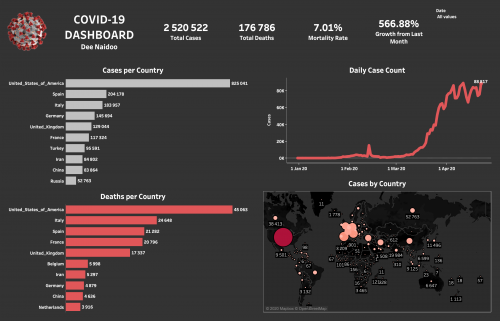
Skillshare – Tableau MasterClass Build and Publish COVID 19 Dashboard-ViGOROUS
English | Size: 579.39 MB
Category: Tutorial
We are living in a data world right now. And, as a Data Engineer practicing in the real world, I know there’s a wealth of information out there that many people and companies don’t know what to do with! [Read more…]
Lynda – Tableau Essential Training 2020 1-APoLLo
English | Size: 595.46 MB
Category: Tutorial
Tableau is a widely used data analytics and visualization tool that many consider indispensable for data-science-related work. Its drag-and-drop interface makes it easy to sort, compare, and analyze data from multiple sources, including Excel, SQL Server, and cloud-based data repositories. In this course, learn what you need to know to analyze and display data using Tableau 2020-and make better, more data-driven decisions for your company. Discover how to install Tableau, connect to data sources, and sort and filter your data. Instructor Curt Frye also demonstrates how to create and manipulate data visualizations-including highlight tables, charts, scatter plots, histograms, maps, and dashboards-and shows how to share your visualizations. Along the way, he highlights the new features packed into this edition of the software, including Viz Animations, which allows you to visually follow the movement of marks in a data visualization to see and understand your changing data. [Read more…]
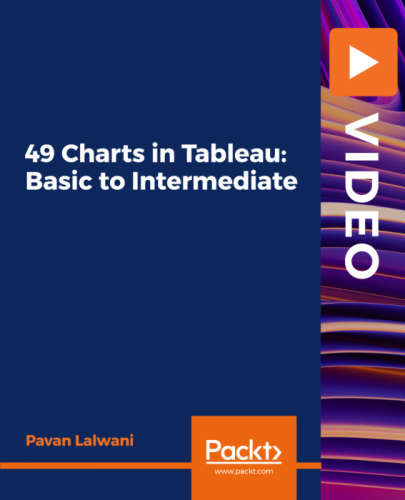
Packt – 49 Charts in Tableau Basic to Intermediate-ZH
English | Size: 1.77 GB
Category: Tutorial

Linkedin Learning – Tableau and R for Analytics Projects-ZH
English | Size: 279.04 MB
Category: Tutorial
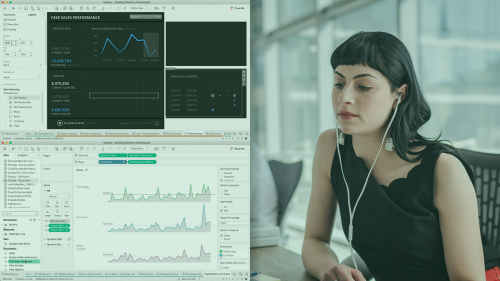
PluralSight – Building Effective Dashboards with Tableau Desktop-BOOKWARE-KNiSO
English | Size: 420.06 MB
Category: Tutorial

Packt – Python, SQL, Tableau Integrating Python, SQL, and Tableau-JGTiSO
English | Size: 1.65 GB
Category: Tutorial

Packt – Python, SQL, Tableau Integrating Python, SQL, and Tableau
English | Size: 1.63 GB
Category: Tutorial